![]()
Aspiring Secret Agents: Encrypting & Deciphering Secret Codes Activities
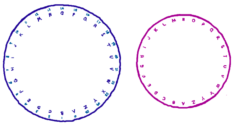
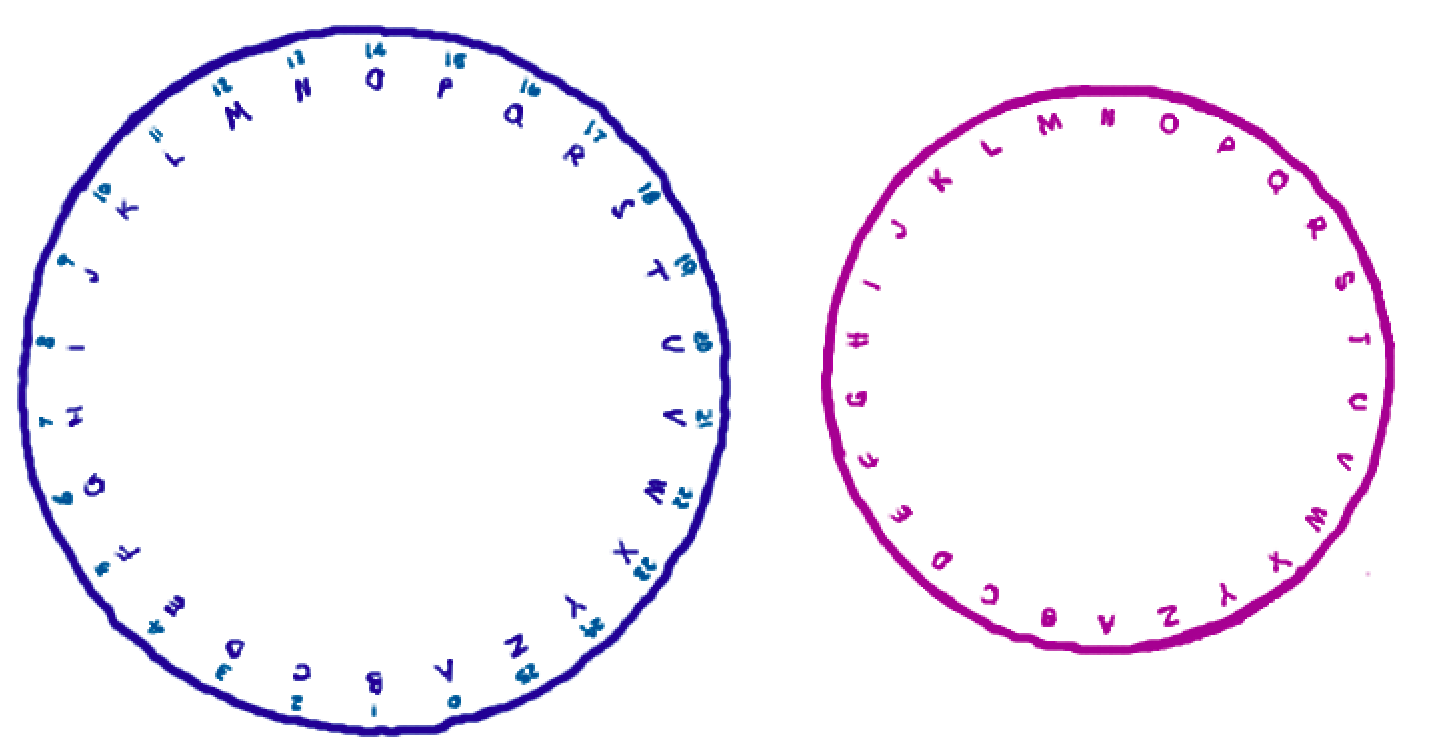
- Code wheels: A simple way to encode Caesar codes.
Instructions:- Cut out the circles. Place the smaller circle over the larger circle, and place a paper fastener through the center of both circles.
- Rotate the smaller circle to the right (clockwise) by the appropriate number of units. To encode a message, replace plaintext letters from the smaller circle with ciphertext letters from the larger circle. To decode, replace ciphertext letters from the larger circle with plaintext letters from the smaller circle.
– Download the code wheels by clicking on the image and then right clicking to save to your computer:
- Coloring Numbers:
Instructions:- The chart below has the numbers 1 through 100. The numbers colored in red are the numbers divisible by 5, they are lined up nicely in two columns! Color the numbers that are divisible by 9. Do they have an interesting pattern too? How about numbers divisible by 4? Use different colors for a better view of the patterns.
- Download the coloring numbers chart and get started on this fun activity!
- In Chapter 4 we learned how to find prime numbers using the sieve of Eratosthenes. We colored all numbers, except for 2, that can be divided by 2. We then colored all numbers that can be divided by 3, and so on. Here is a computer animation that simulates this process. (Reference to WikiMedia Commons, https://commons.wikimedia.org/wiki/File:Sieve_of_Eratosthenes_animation.gif).
- In Chapter 6 Dr. O explains that when we roll a fair die, the chances of having each particular number appear on the top of the die is ⅙. As a decimal this is approximately 0.17. The animation below simulates the roll of die. On the right panel you see the outcomes. The left panel shows the frequency of each outcome, and the animation restarts after 240 rolls. On the top of the left panel, you see the frequencies of each outcome, and its proportion in parenthesis, as the die is rolled. At the end of the 240 rolls, the proportions of each outcome are:
Outcome 1 2 3 4 5 6 Proportion 0.154 0.154 0.204 0.183 0.162 0.142 As we increase the total number of rolls, we expect the proportions to get closer and closer to 0.17.
- Here is a similar animation. This time we are flipping coins! Heads and Tails on the right panel, and their frequencies on the left. The total number of flips is 100. At the end, the proportion of Heads is 0.53, and the proportion of Tails is 0.47.
- At the end of the book, Dr. O was throwing darts to find the area of some figure. Below is an animation for throwing darts: we want to find the area under the curve, which is the plot for the function y=x2. After 200 darts are thrown, the number of those under the curve divided by the total number of darts, 200, is 0.37. The true value of the area, which can be computed using calculus, is about 0.33.
The animations are adapted from:
Xie, Y. (2013). animation: An R Package for Creating Animations and Demonstrating Statistical Methods. Journal of Statistical Software, 53(1), 1 – 27. doi:http://dx.doi.org/10.18637/jss.v053.i01
Acknowledgement:
Thanks to Yiran Chen for her help with the animations.
This digital program is being offered in partnership with the LeRoy Collins Leon County Public Library System in Dr. O’s hometown of Tallahassee, Florida. Visit the Library website – HERE


